 BeNewz
Related Articles


Sugar prices surge to Rs 229 per kg
Aftab Maken
ISLAMABAD: The Pakistan Bureau of Statistics says the Sensitive Price Indicator rose 0.53% in the week ended 13 Nov 2025, driven by sharp increases in chicken and tomatoes.
The Pakistan Bureau of Statistics (PBS) said the Sensitive Price Indicator (SPI) for the week ending November 13, 2025, climbed by 0.53% over the previous week. This follows a stability period and reflects short-term inflation pressures across essential commodities measured from 51 items in 17 cities.
According to the Statistics Bureau’s report, the maximum price of sugar per kilogram in the country has reached Rs 229. In the last week, the price of sugar per kilogram in Quetta increased by Rs 19.
As per the Statistics Bureau’s report, the price of sugar per kilogram in Quetta has increased from Rs 210 to Rs 229. The citizens of Quetta are compelled to buy the most expensive sugar in the country at Rs 229 per kilogram.
According to the report:
- The maximum price of sugar per kilogram in Peshawar is up to Rs 200.
- The maximum price of sugar per kilogram in Karachi and Islamabad is up to Rs 195.
- The maximum price of sugar per kilogram in Rawalpindi is Rs 190.
According to the report, the average price of sugar per kilogram in the country has dropped to Rs 185.47. In the past week, the average price of sugar per kilogram decreased by Rs 2.01 (two rupees and one paisa).
Last week, the average price of sugar per kilogram in the country was Rs 187.48, whereas a year ago, the average price of sugar per kilogram was Rs 132.24.
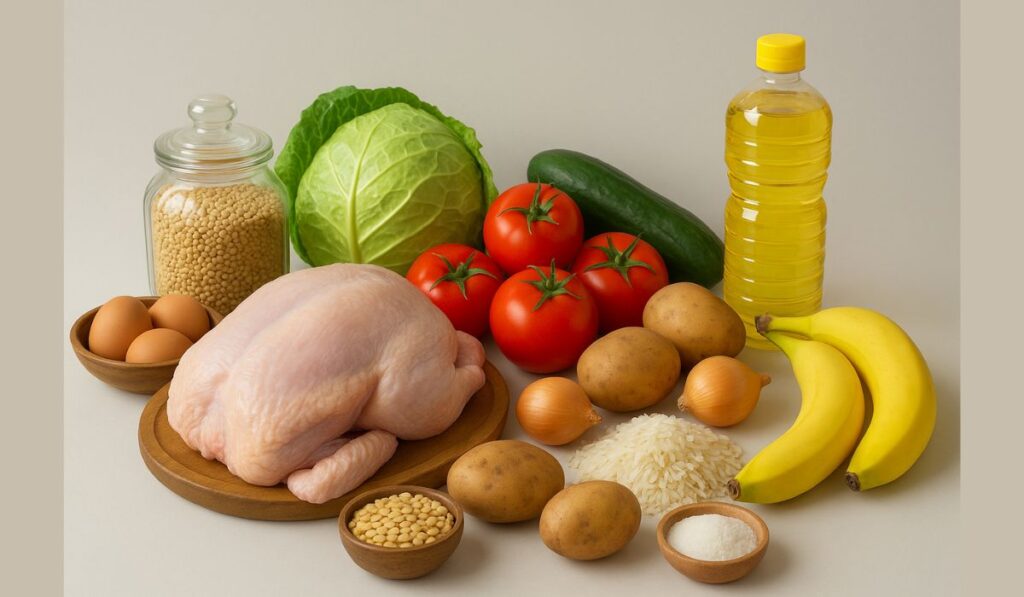
On a year-on-year basis the SPI registered a rise of 4.15%, signalling persistent inflationary momentum despite some easing in recent months. Among the largest week-to-week increases were: chicken (+20.33%), tomatoes (+12.03%), bananas (+2.32%), liquefied petroleum gas (LPG) (+1.97%), potatoes (+1.08%) and 5-litre cooking oil (+0.38%). Meanwhile, key decreases included onions (-6.65%), pulse gram (-2.61%), salt powder (-1.80%), gur (-1.78%), sugar (-1.07%), wheat flour (-0.69%) and pulse mash (-0.66%).
Of the 51 items surveyed, 15 items (29.41%) recorded price increases, 12 items (23.53%) saw declines and 24 items (47.06%) remained unchanged in the week.
The annual comparisons highlight elevated price increases in non-food items such as ladies’ sandals (+55.62%), energy (gas charges Q1 +29.85%) and food items like sugar (+40.25%) and wheat flour (+18.70%). At the same time, declines were noted for items like garlic (-36.29%), rice IRRI-6/9 (-3.02%) and potatoes (-22.46%) when compared with the same week last year.
Economists say the weekly SPI provides a short-term view of inflation pressures, particularly in the food and energy space, complementing the broader Consumer Price Index (CPI) readings. The week’s uptick suggests fresh pressures building from food commodity supply disruptions and energy costs.
While the year-on-year increase of 4.15% remains moderate relative to recent peaks, the rise in key staples such as chicken and tomatoes could translate into broader household cost burdens if sustained. The government’s monitoring of the SPI will be closely watched to assess whether further monetary or fiscal adjustments are required to anchor inflation expectations in the coming months.